Environment
Collecting Data
As technology and operating systems continue to evolve, and our sustainability program continues to develop, we’ve had to find new ways to measure and collect data. Our newest tool is a software program that allows us to more efficiently gather environmental footprint data at an individual site level. The goal is to better understand resource consumption and to find ways not just to reduce our footprint, but to also do so in ways that make the most positive impact. The data will allow us to see where making adjustments with inputs like water or energy can have the greatest benefit, and help us set and achieve sustainability goals across our operations.
We’re in the early stages of development, but we’re moving quickly. We’ve engaged in a multi-year program of data gathering using the GRI framework and our existing EcoEfficiency Program to establish a baseline for the company. This year, we started with our “bricks and mortar” locations (all those locations that have a physical structure on-site) and will, in successive years, expand this scope to include all owned, contracted and leased locations.
As we progress towards our goal to report on all material GRI environmental indicators, and do so on all owned, contracted and leased sites, we will gradually replace our EcoEfficiency reporting for just the crop protection sites with more inclusive reporting for all of our locations. This year, we are integrating the GRI Energy Indicators GRI EN 3 GRI EN 4 , Greenhouse Gasses Emissions GRI EN 16 and the Water Indicators GRI EN 8 GRI EN 10 GRI EN 21 from all of our “bricks and mortar” locations, along with our crop protection EcoEfficiency information.
Our progressive and inclusive approach to expand data capture and reporting beyond our own operations, and track resource use in the field, is unique to the agriculture industry. When complete, this approach will be a significant accomplishment. Although gathering data for hundreds of “brick and mortar” field locations spread throughout the world presented significant obstacles in language, and reporting units, and although we know that more challenges await as we integrate our reporting approach into the thousands of field locations worldwide, we believe that our inclusive approach will produce a deeper understanding of our opportunities to improve our environmental footprint.
Reported data in the following tables and graphs is rounded to three significant digits or, for small values, presented as no less than one tenth the indicator reporting unit. This approach enhances data usability while providing sufficient detail without becoming numerically cumbersome.
GRI EN 3 Direct Energy Consumption (1000 gigajoules)
| Crop Protection | Seeds & Traits | Company Total |
|
|---|---|---|---|
| Note for Table EN03: Data for biomass fuels is reported in the above table. By definition, GRI EN03 does not include combustion of biomass fuels because they are a renewable resource. We are providing this data to be transparent and highlight our efforts to generate and utilize renewable fuel sources. |
|||
| Natural Gas and Other Gaseous Fuels | 4,700 | 2,140 | 6,830 |
| Oil (Including Diesel) | 159 | 598 | 757 |
| Coal, Coke and Other Solid Fuels | 1,400 | 0.1 | 1,400 |
| Waste Fuel | 3,020 | 0 | 3,020 |
| Total | 9,280 | 2,730 | 12,000 |
| Biomass fuels used in direct energy generation | 207 | 950 | 1,160 |
| Biomass fuels shipped off-site for energy generation | 0 | 67.3 | 67.3 |
GRI EN 4 Indirect Energy Consumption (1000 gigajoules)
| Crop Protection | Seeds & Traits | Company Total |
|
|---|---|---|---|
| Note for Table EN04: The total amount of electricity is shown above along with the fractional amount of raw materials estimated to be necessary to produce this electricity. The conversion factors for electricity to raw material resource were taken from the EPA and the World Resources Institute GHG Protocol Initiative databases. |
|||
| Indirect Sources: | |||
| Purchased Electricity | 6,670 | 1,460 | 8,120 |
| Imported Steam | 1,350 | 0 | 1,350 |
| Total | 8,020 | 1,460 | 9,470 |
| Consumed Primary Sources in Electricity Generation (Percent of Total Indirect Energy) | |||
| Hydro, Biomass, Geothermal, Nuclear, Solar, Wind | 72% | 36% | 64% |
| Natural Gas and Other Gaseous Fuels | 16% | 18% | 17% |
| Coal, Coke, and Other Solid Fuels | 10% | 39% | 17% |
| Oil (Including Diesel) | 1% | 6% | 2% |
GRI EN 3 GRI EN 4 Summary (1000 gigajoules)
| Crop Protection | Seeds & Traits | Company Total |
|
|---|---|---|---|
| Total Energy Consumption - Direct and Indirect | 17,300 | 4,190 | 21,500 |
GRI EN 8 Water Withdrawal (ML – 1000 cubic meters)
| Crop Protection | Seeds & Traits | Company Total |
|
|---|---|---|---|
| Total | 19,100 | 3,460 | 22,500 |
| Surface Water | 2,810 | 718 | 3,530 |
| Ground Water | 14,600 | 1,750 | 16,300 |
| Municipal Water | 1,570 | 848 | 2,420 |
| Collected Rainwater | 74.3 | 128 | 202 |
| Purchased Wastewater for Reuse (R1) | 0 | 15.9 | 15.9 |
| Purchased - Bottled or Lab Water | 0.3 | 1.5 | 1.8 |
GRI EN 10 Water Reuse and Recycle (ML – 1000 cubic meters)
| Crop Protection | Seeds & Traits | Company Total |
|
|---|---|---|---|
| Total | 36,000 | 32,100 | 68,100 |
| Volume of Condensate/Cooling Tower Water Recycled/Reused | 35,800 | 32,100 | 67,800 |
| Volume of On-Site Process Waste Water Recycled/Reused | 270 | 35.9 | 306 |
GRI EN 16 Total Direct and Indirect GHG Emissions Source (1000 metric tons)
| Crop Protection | Seeds & Traits | Company Total |
|
|---|---|---|---|
| Note for Table EN16: While GRI EN16 reporting does not include GHG emissions from combustion of biomass fuels, data for GHG emissions associated with biomass fuel generation and use is reported in the above table. We are providing this data to be transparent regarding our GHG emissions and to highlight our efforts to generate and utilize renewable fuel sources. |
|||
| Direct GHG Emissions (CO2-eq) | 1,320 | 161 | 1,480 |
| Indirect GHG Emissions (CO2-eq) | 320 | 219 | 539 |
| Total | 1,640 | 380 | 2,020 |
| GHG Emissions From Biomass Fuels | |||
| CO2eq from Biomass Used (Consumed) On-Site | 25 | 103 | 128 |
| CO2eq from Biomass for Off-Site Energy Generation | 0 | 7.3 | 7.3 |
Process Waste Water Discharged (metric tons- 1000 cubic meters)*
| Crop Protection | Seeds & Traits | Company Total |
|
|---|---|---|---|
| Discharged to Off-Site Treatment (eg. POTW) | 790 | 431 | 1,220 |
| Permitted Discharges to the Environment - Subsurface (eg. Deepwell/Leachfield) | 1,830 | 35.0 | 1,870 |
| Permitted Discharges to the Environment - Surface Water (eg. River) | 16,200 | 36.6 | 19,300 |
| Total | 18,800 | 503 | 19,300 |
| Process Waste Water Quality Data for Direct Surface Water Discharges (MT) | |||
| BOD | 48.6 | 0 | 48.6 |
| Nitrate (as N) | 28.8 | 0 | 28.8 |
| Phosphates (as PO4) | 224 | 0 | 224 |
| Total Suspended Solids (TSS) | 71.2 | 0 | 71.2 |
*Process waste water only, does not include Domestic Sewage per GRI Guidelines
EcoEfficiency Data on Crop Protection
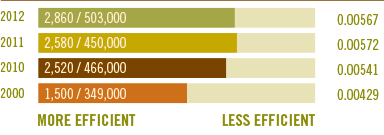
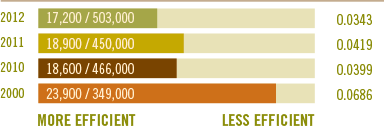
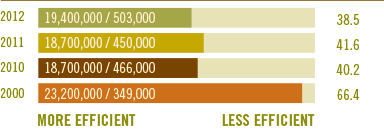
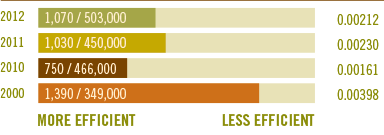
The following graphs show information for our crop protection sites only.
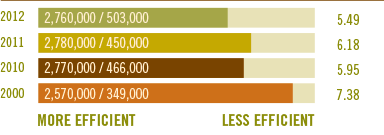
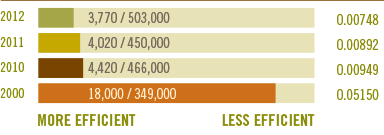
The data for these graphs was collected through recognized reporting procedures. The methodology used was developed in cooperation with the World Business Council for Sustainable Development. This system permits comparisons of new data to the baseline data from calendar year 2000. That graphical data is shown on a per product basis to provide consistent comparability across the years. The values on the graphs were calculated using un-rounded data so comparisons to the previous tables (where numbers were rounded to two significant digits) may not result in exact matches.
GRI EN 3 Energy Consumption
Energy (gigajoules) / Product Output (metric tons)
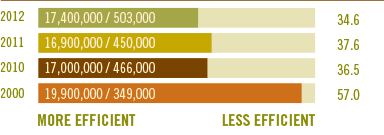
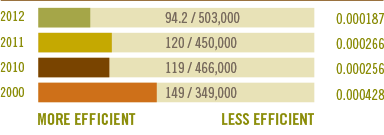
GRI EN 16 Direct Greenhouse Gas Emissions
Carbon dioxide-eq (metric tons) / Product Output (metric tons)
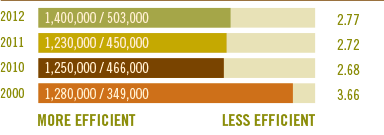
GRI EN 17 Indirect Greenhouse Gas Emissions
Carbon dioxide-eq (metric tons) / Product Output (metric tons)
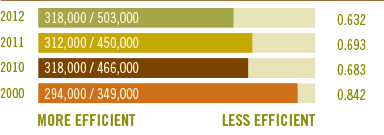
GRI EN 20 Chemical Oxygen Demand (COD)
Oxygen-eq (metric tons) / Product Output (metric tons), COD to Surface Water
GRI EN 22 Waste Shipped Offsite
Waste (metric tons) / Product Output (metric tons)
GRI EN 8 Fresh Water Consumption
Water (cubic meters) / Product Output (metric tons)
GRI EN 22 Eutrophication
Phosphate-eq (metric tons) / Product Output (metric tons) Phosphates to Surface Water
GRI EN 22 Acidification Emissions
Sulfur Dioxide-eq (metric tons) / Product Output (metric tons)
GRI EN 22 Photochemical Oxidant Creation
Volatile Organic Compounds (metric tons) / Product Output (metric tons)
GRI EN 1 Raw Material Consumption
Materials (metric tons) / Product Output (metric tons)